New Paltz for Distraction-Free Schools Add your name

Tap any chart to open it full size.
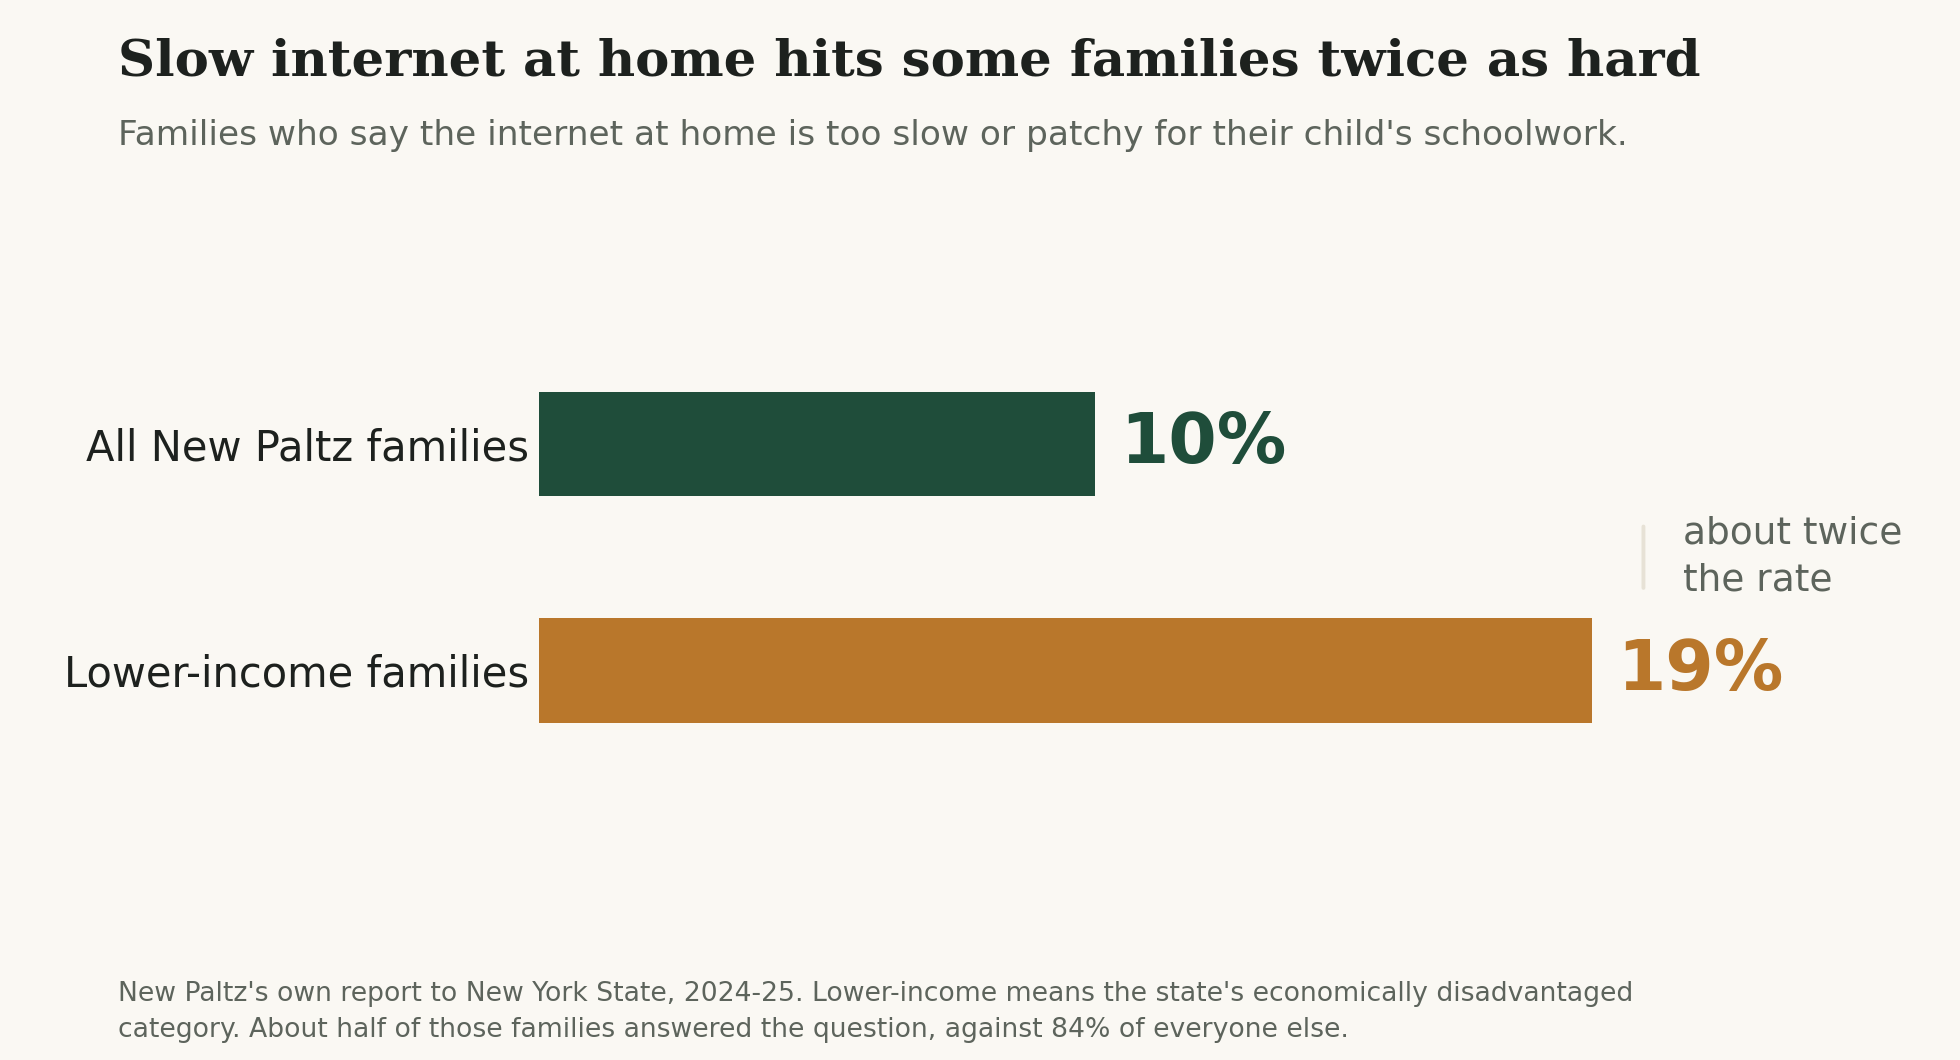
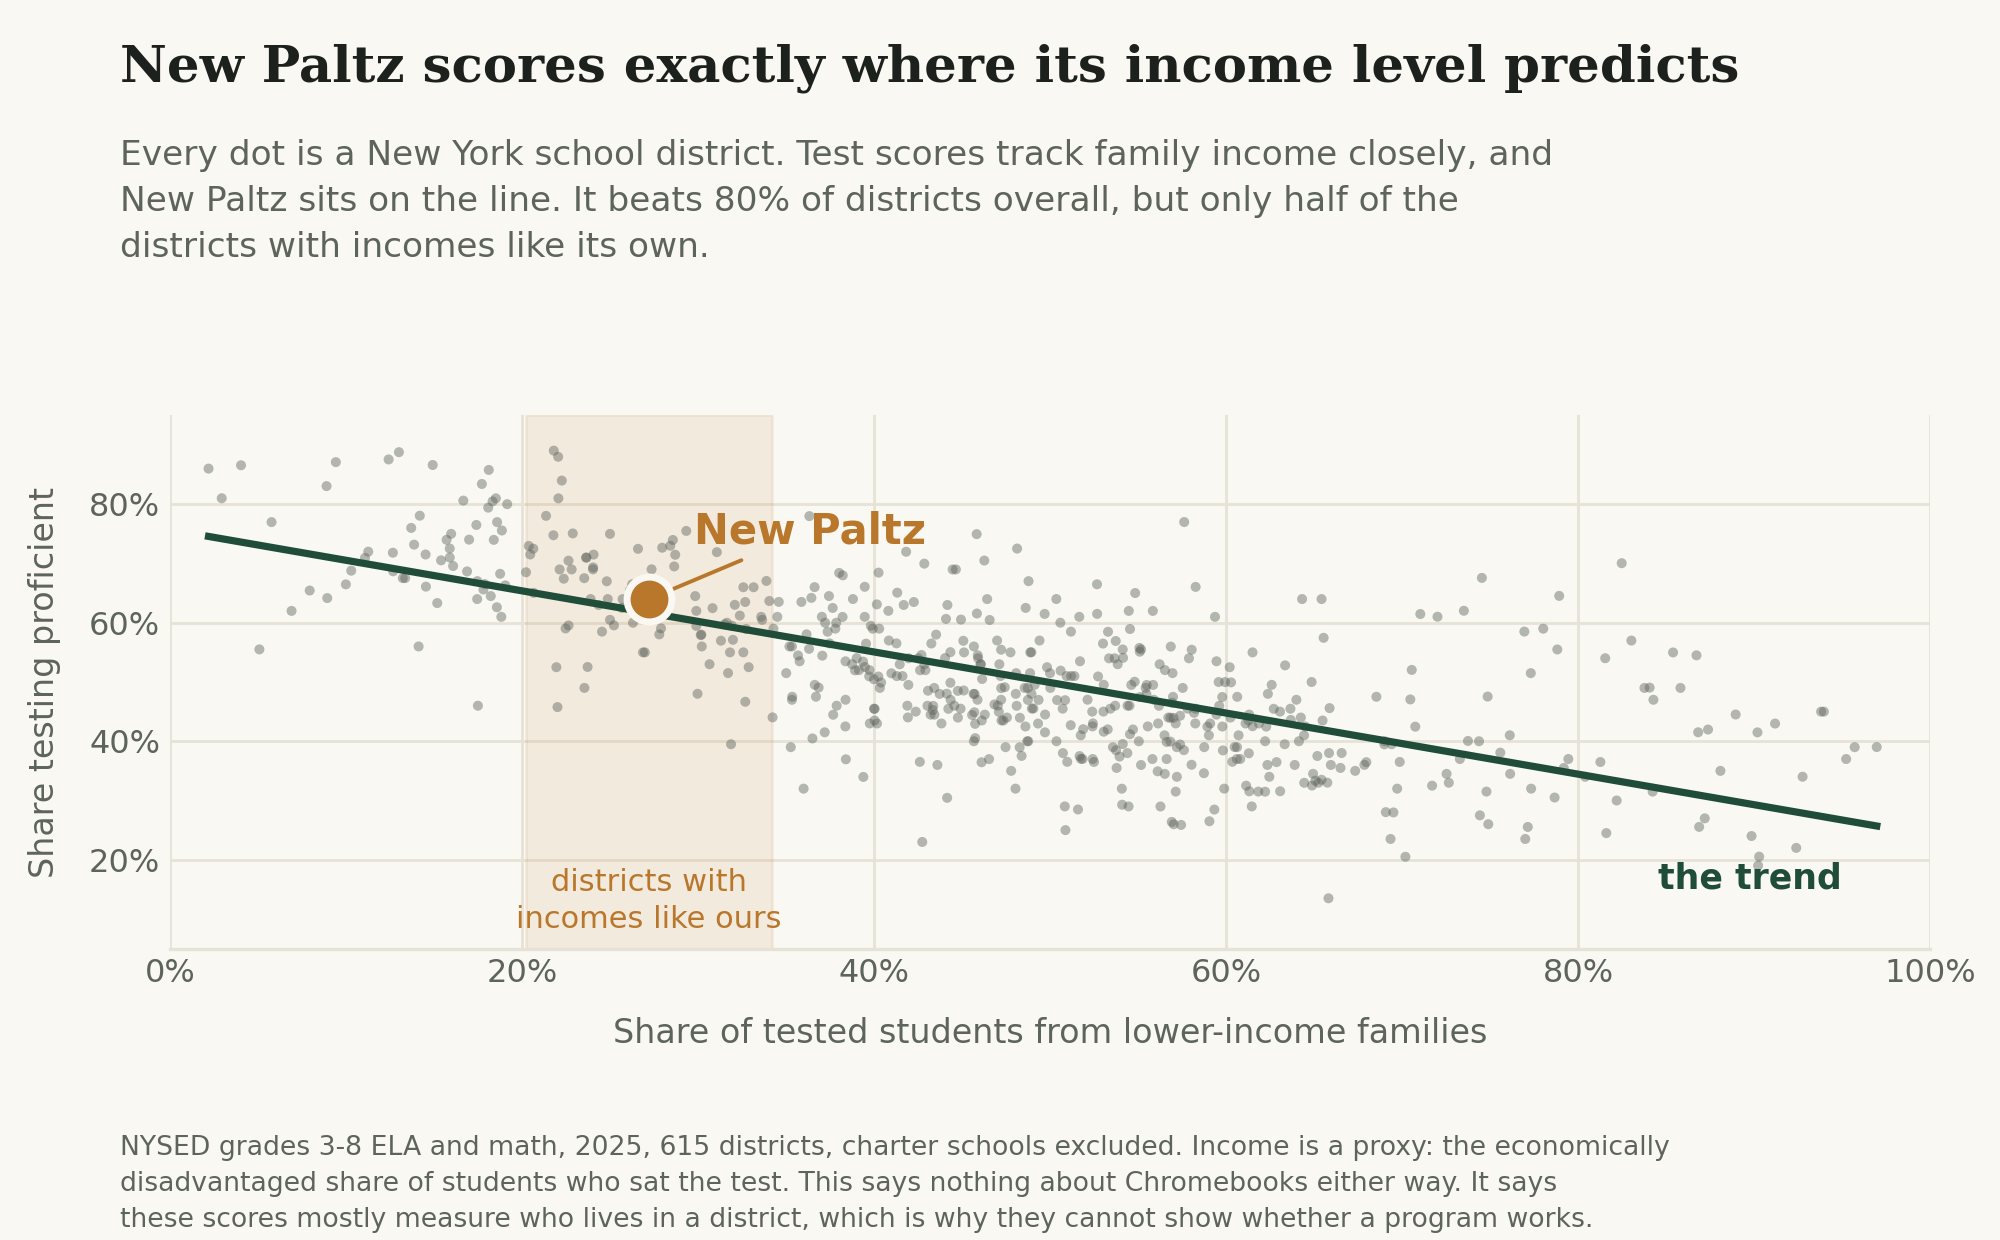
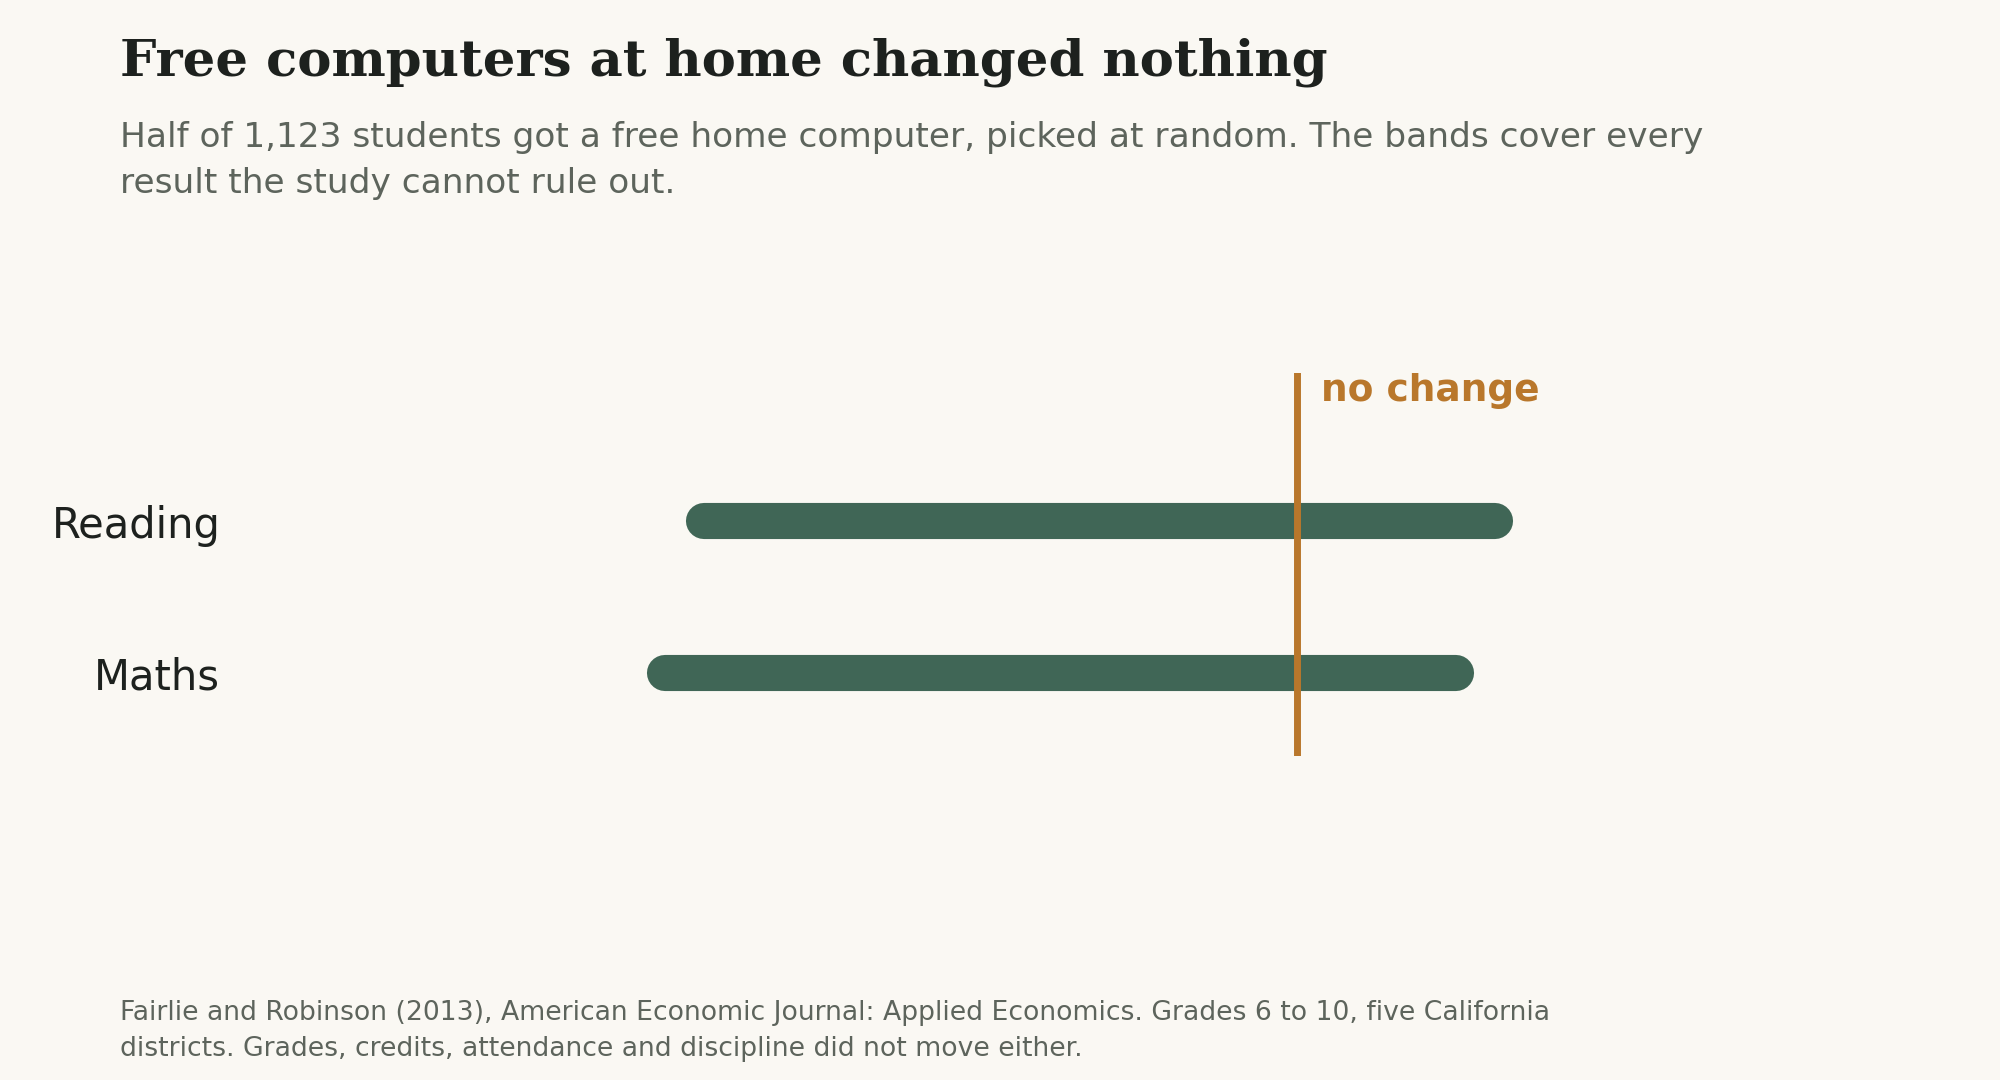
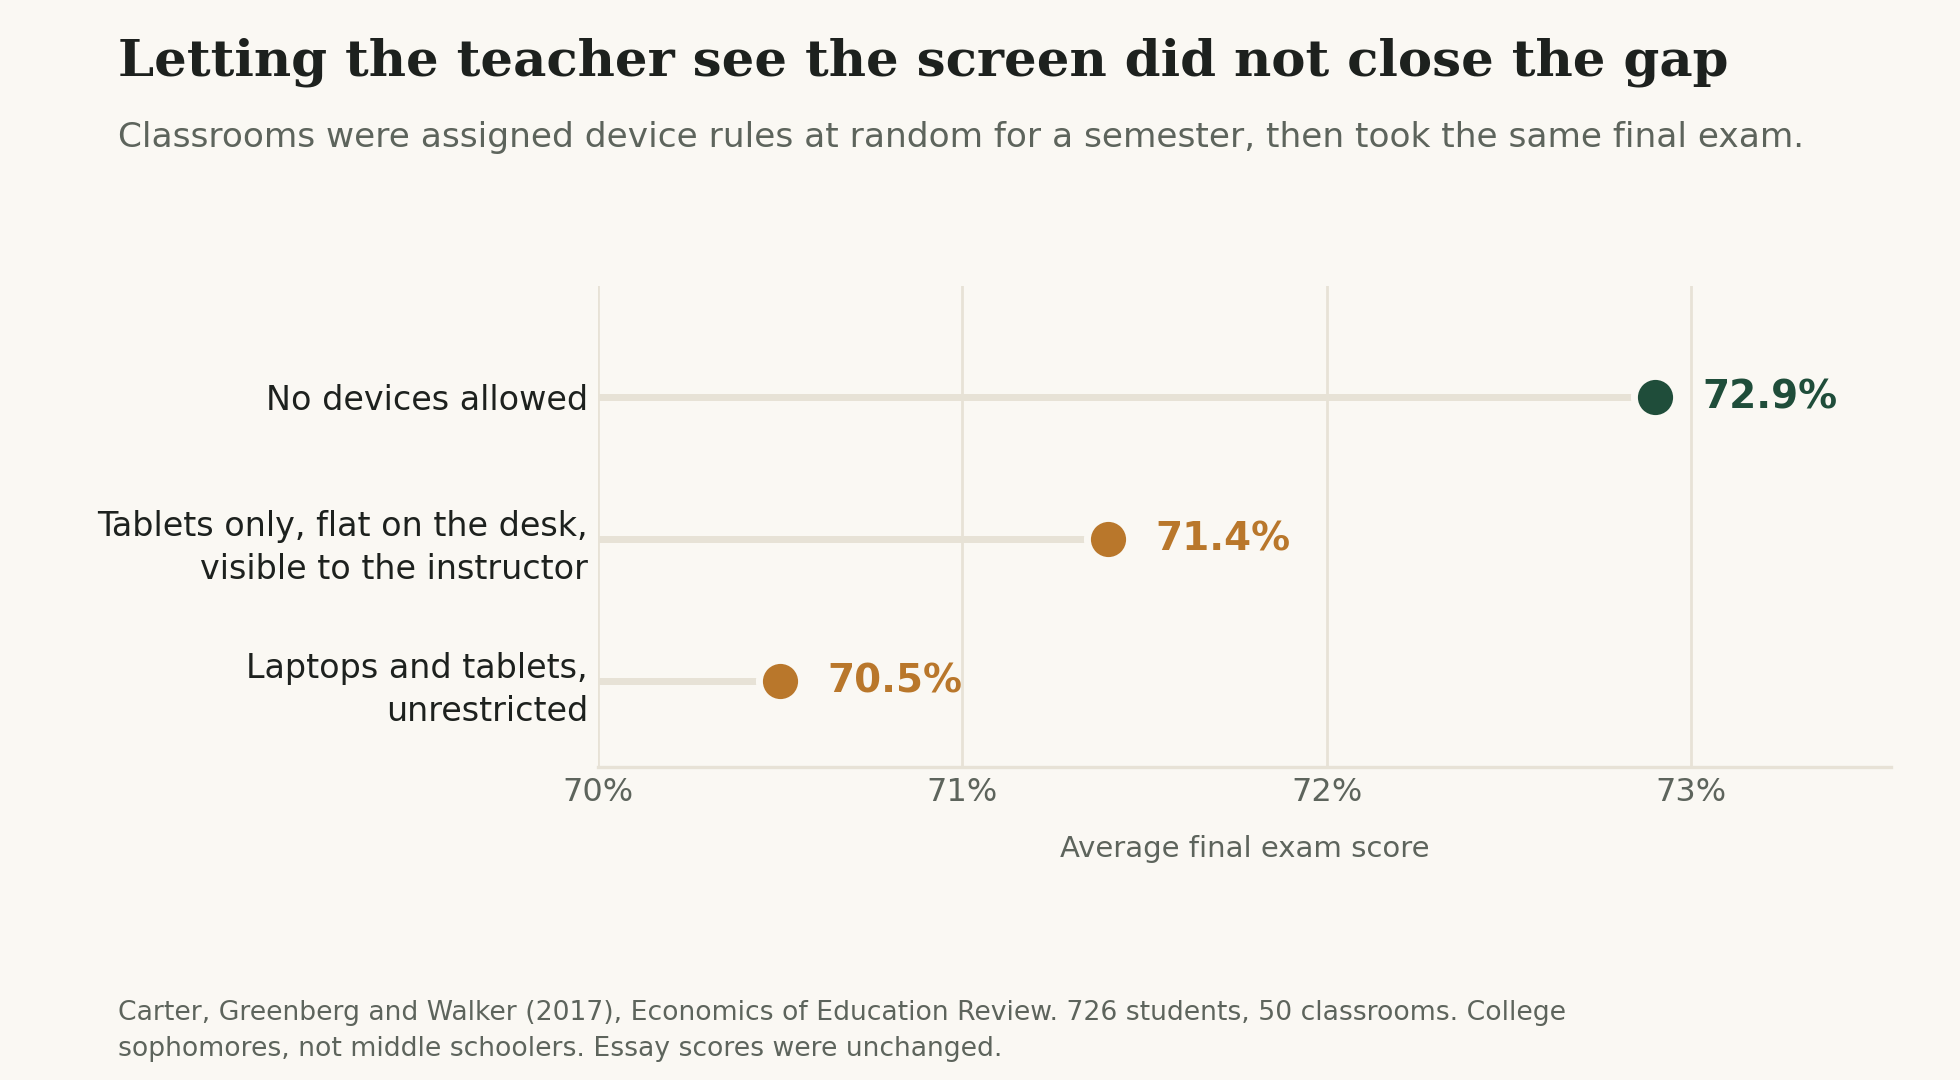
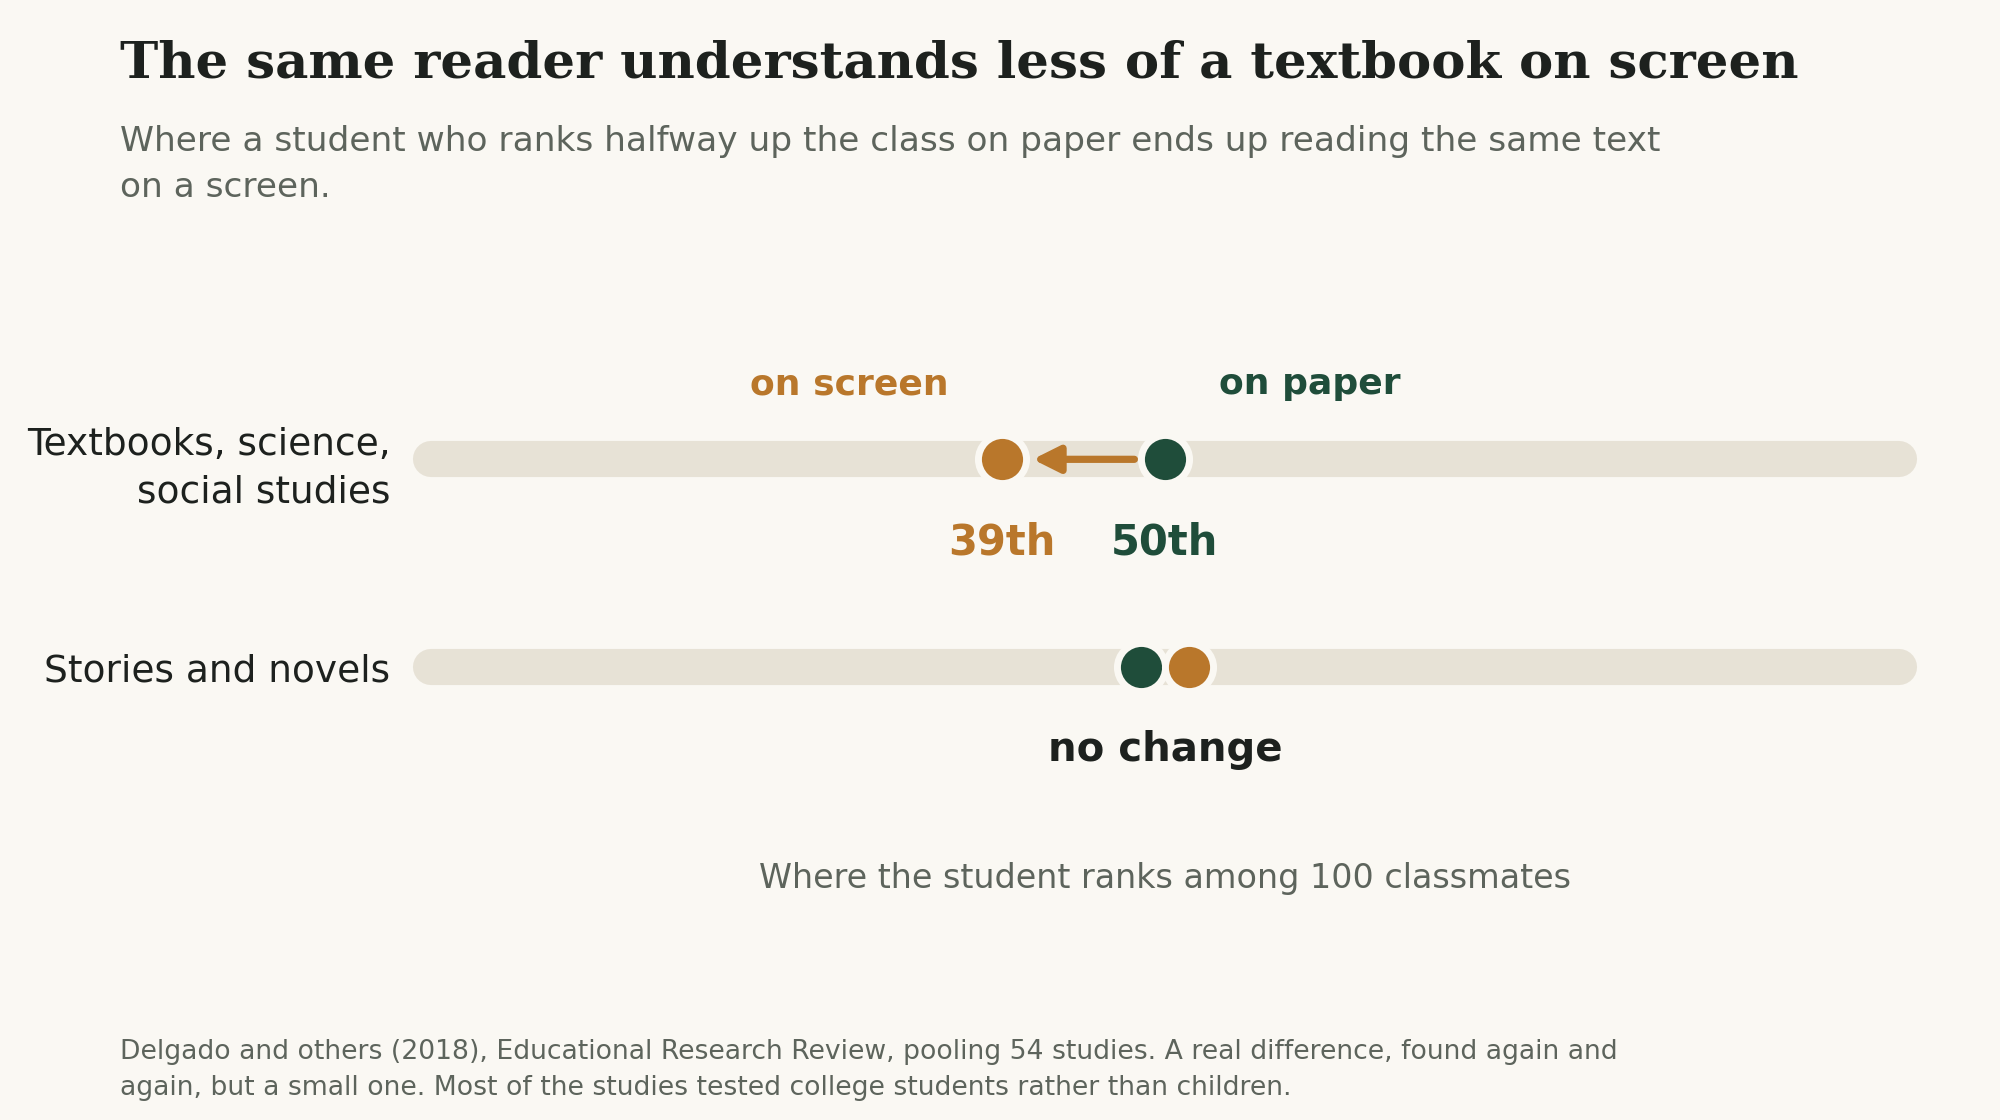
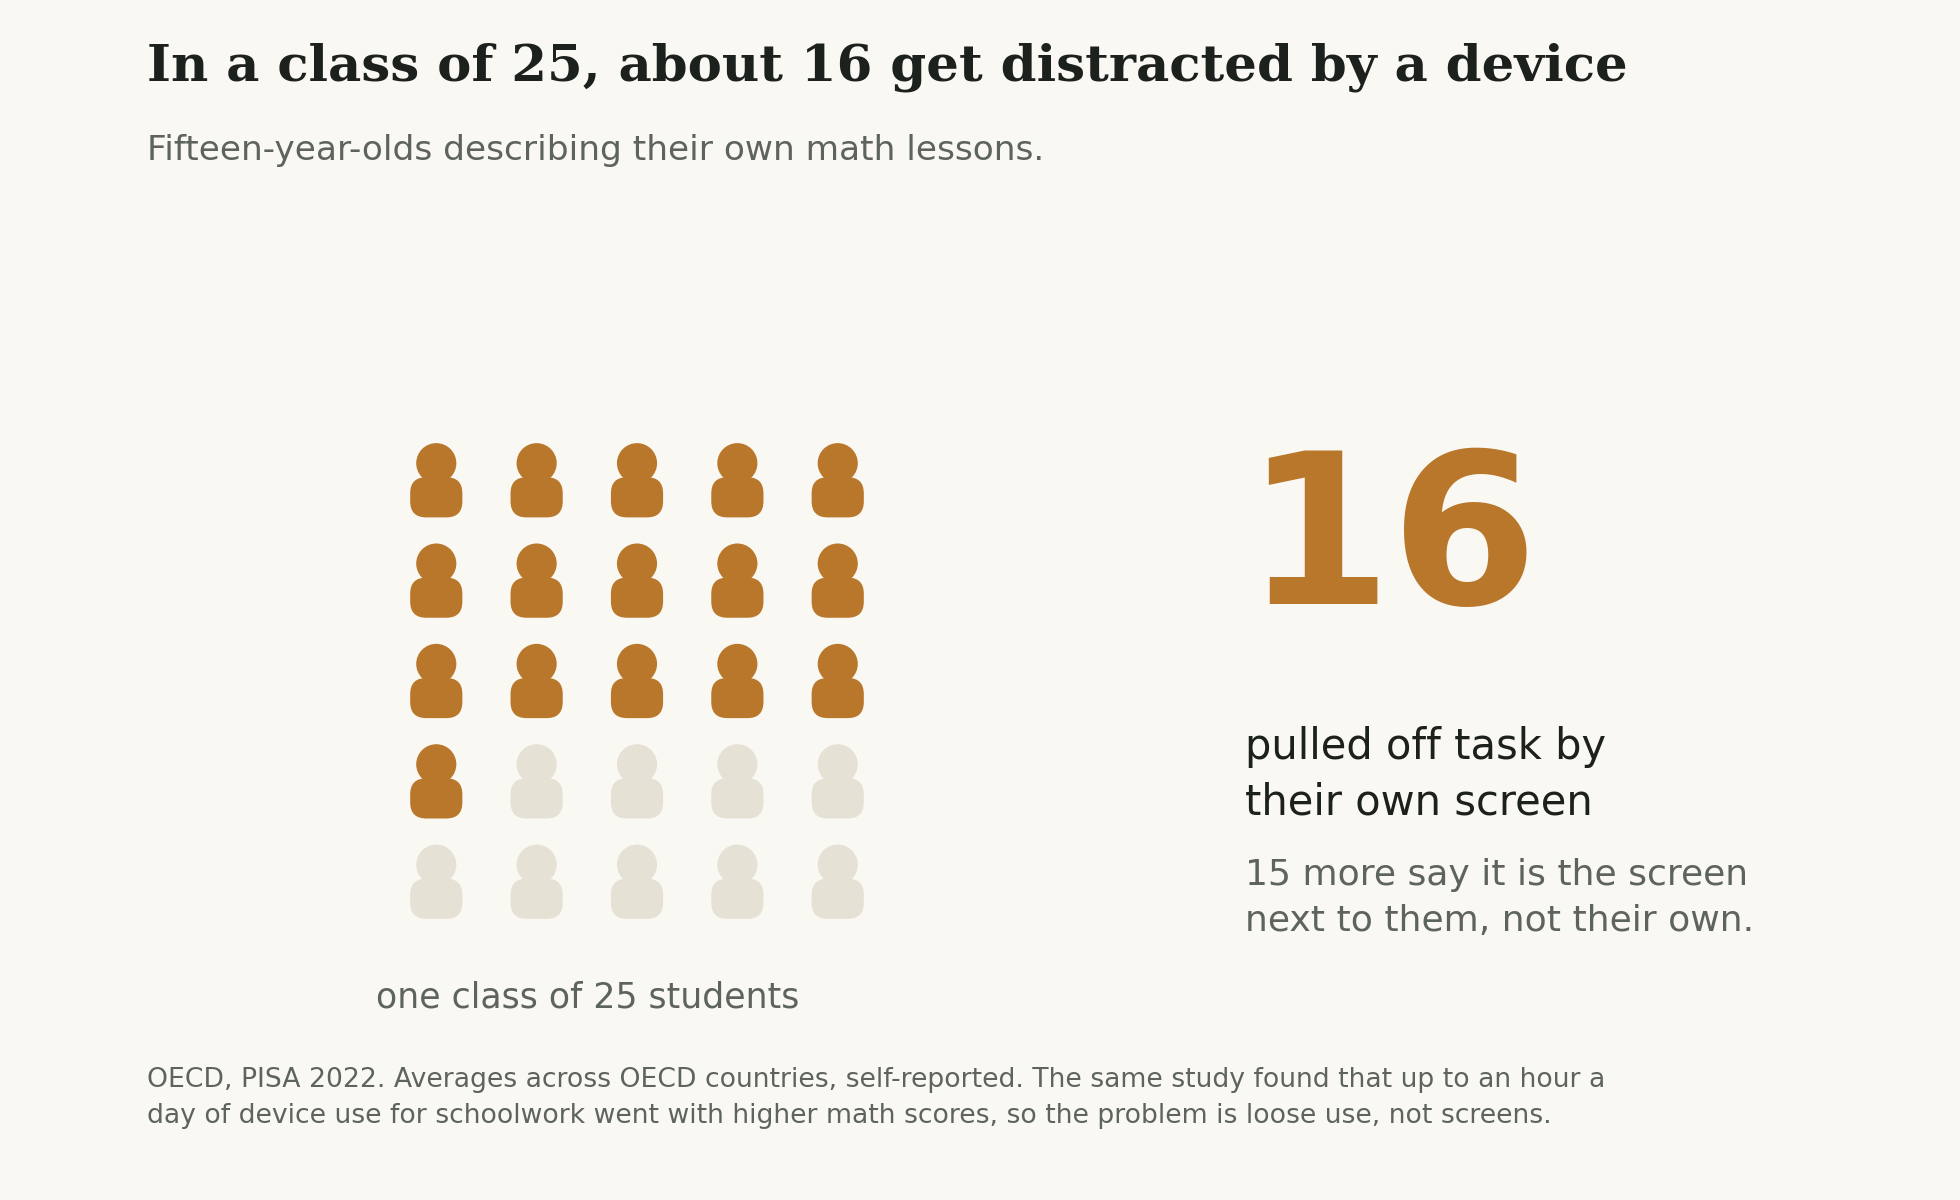
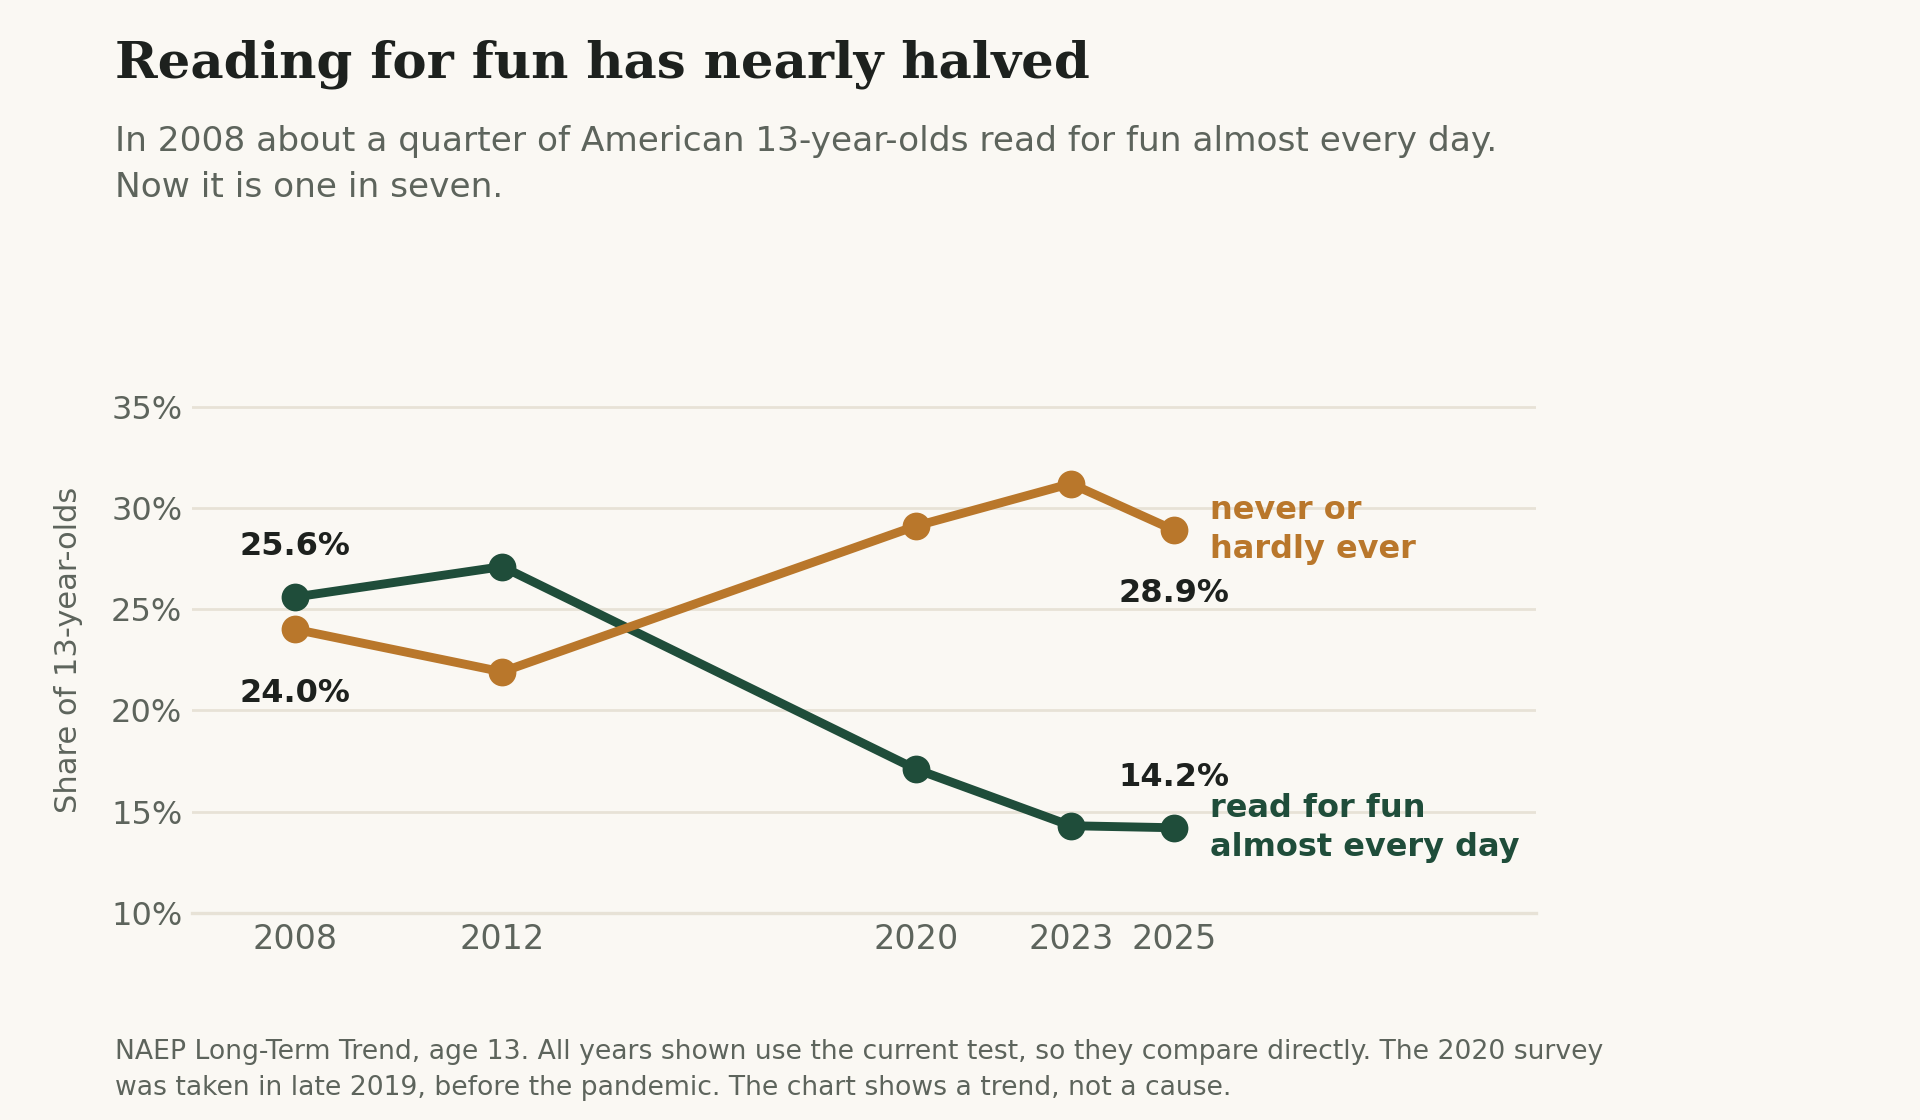
Bar chart: slow internet at home hits some families twice as hard. 10 percent of all New Paltz families say the internet at home is too slow or patchy for their child's schoolwork, against 19 percent of lower-income families. Scatter chart: New Paltz scores exactly where its income level predicts. Every dot is one of New York's 615 school districts, plotted by the share of tested students from lower-income families against the share testing proficient. Test scores track income closely and New Paltz sits on the trend line. Chart: free computers at home changed nothing. Half of 1,123 students got a free home computer at random. The range of results the study cannot rule out sits on no change, for reading and for math. Chart: letting the teacher see the screen did not close the gap. Classrooms were given device rules at random. Students whose tablets lay flat and visible to the instructor still scored below students in device-free rooms. Chart: the same reader understands less of a textbook on screen. A student ranked halfway up the class on paper ranks about 39th of 100 reading the same textbook material on a screen. For stories there is no change. Pictogram: in a class of 25, about 16 students get distracted by a device in at least some math lessons. Another 15 say it is a classmate's screen rather than their own. Line chart: reading for fun has nearly halved. In 2008 about a quarter of American 13-year-olds read for fun almost every day; by 2025 it is one in seven, while the share who never or hardly ever read rose.

Charts are our own, built from the figures published in each source named on them. Where a source's authors state a limitation, we have repeated it rather than leaving it out. If you find an error, tell us and we will correct it.